NAV - SIPA Balanced FUND
All amounts are expressed in GBP
Funds' Unit Price at launch date: 100
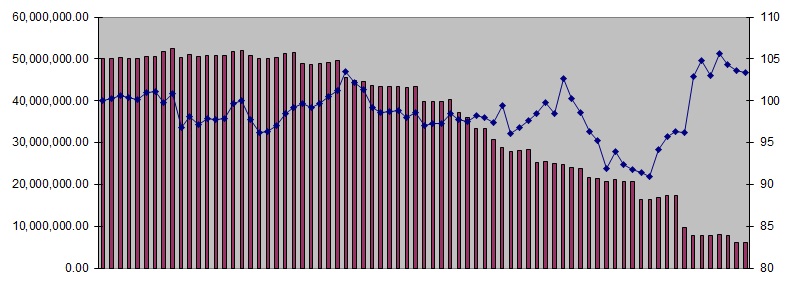
Performance graph from Inception
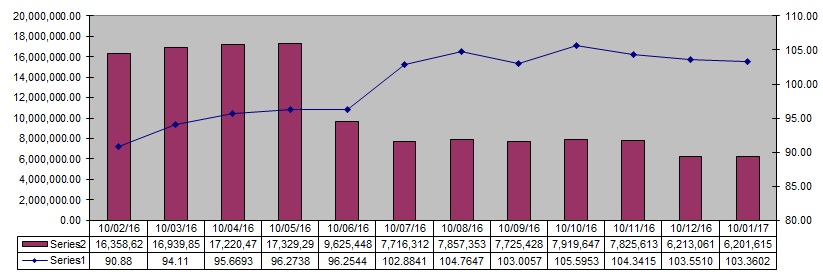
Performance graph over the last twelve months
| from up to | NAV | Percentage |
| Inception to 31.12.2010 | 101.2536 | 1.25% |
| 01.01.2011 to 31.12.2011 | 96.7237 | -4.47% |
| 01.01.2012 to 31.12.2012 | 99.1370 |
2.49% |
| 01.01.2013 to 31.12.2013 | 97.2479 | -1.37% |
| 01.01.2014 to 31.12.2014 | 97.3844 | 0.14% |
| 01.01.2015 to 31.12.2015 | 92.4889
| -5.03% |
| 01.01.2016 to 10.01.2017 | 103.3602
| 11.75% |
